SOFTWARE ENGINEERING EXPERIENCE
Collaborative software visualization for distributed software developer teams.
Software Visualization
Abstract and highly configurable visualization of software.
Convergent Technologies
Integration of heterogenous visualization hardware:
desktop computers, tablets, virtual and augmented reality.
Multi-User Environment
Multiple developers can join remotely and communicate to each other from anywhere in the world.
Use Cases
Every developer knows the feeling of uncertainty on whether all team members share the same view on their software, let alone whether this view is actually accurate. Do all team members have the same idea of the software’s architecture? How does the system behave at runtime? How has it evolved over time? Does it meet its quality requirements? And are the answers to these questions facts or fiction? SEE provides accurate views and enables team members to align their different views in large software projects. Using modern visualization technology (including but not limited to VR and AR) it even bridges spatial gaps in distributed teams.
How We Created SEE
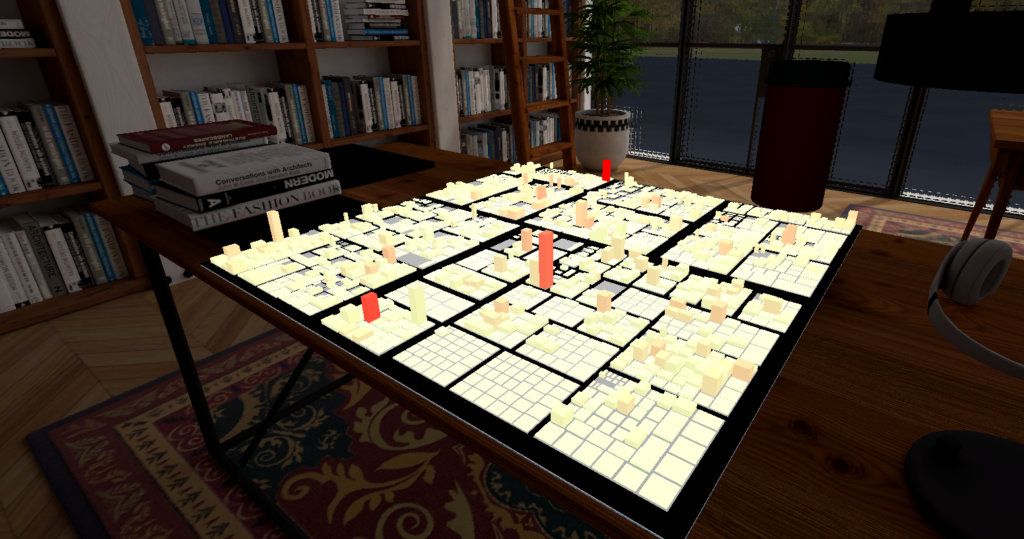
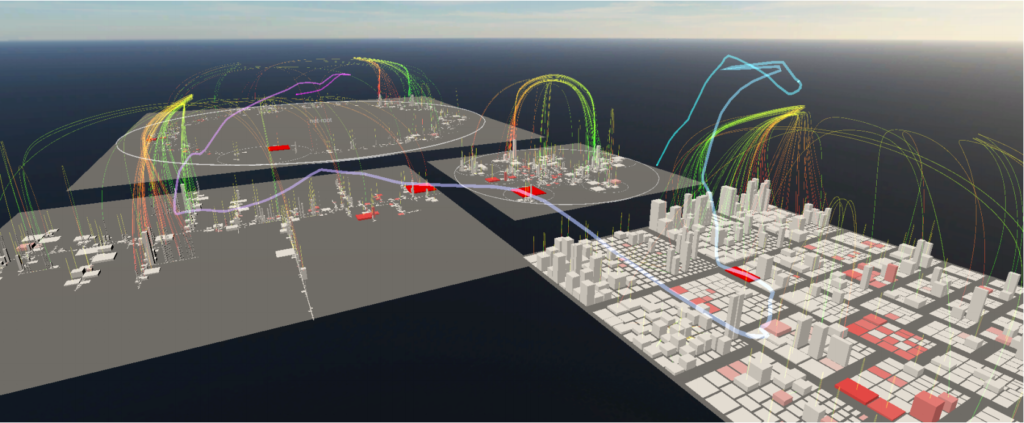
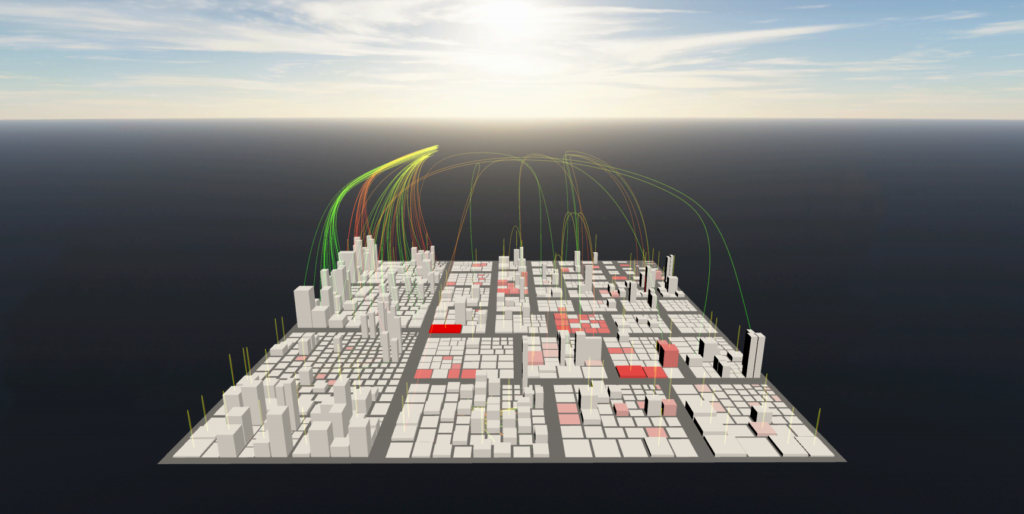
SEE is using Unity as engine. This game development software provides the functionality to establish a virtual realty to work in!
SEE comes with the additional feature of checking the inner quality of your code via metric charts.
One main aspect of SEE is establishing cooperative and productive work from anywhere in the world! Nowadays it is nearly impossible to have every involved person at one place. Why don’t we create our own table anyone can access from any hadware he or she has? According to this idea SEE was born!
Relations between elements (e.g., function calls, include dependencies, etc.) are visualized through hierarchical edge bundles. To create and visualize the underlying splines, SEE makes use of the TinySpline library.
With the dream of working from home but still being able to see each other, the urge for fun needs to find a spot! Thats why a main focus is supporting augmented reality as basic service. Even if only one person has the abilty to use augmented reality, he or she will be able to join the lobby.
Besides that, who does not want to feel the coded projects like never before? Who does not want to have his personal Matrix feeling?
Publications

NURBS, B-Splines, and Bézier curves have a wide range of applications. One of them is software visualization, where these kinds of splines are often used to depict relations between objects in a visually appealing manner. For example, several visualization techniques make use of hierarchical edge bundles to reduce the visual clutter that can occur when drawing a large number of edges. Another example is the visualization of software in 3D, virtual reality, and augmented reality environments. In these environments edges can be drawn as splines in 3D space to overcome the natural limitations of the two-dimensional plane—e.g., the collision of edges with other objects. While Bézier curves are supported quite well by most UI frameworks and game engines, NURBS and B-Splines are not. Hence, spline based visualizations are considerably more difficult to implement without in-depth knowledge in the area of splines.
In this paper we present TinySpline, a general purpose library
for NURBS, B-Splines, and Bézier curves that is well suited for implementing advanced edge visualization techniques—e.g., but not limited to, hierarchical edge bundles. The core of the library is written in ANSI C with a C++ wrapper for an object-oriented programming model. Based on the C++ wrapper, auto-generated bindings for C#, D, Go, Java, Lua, Octave, PHP, Python, R, and Ruby are provided, which enables TinySpline to be integrated into a large number of applications.
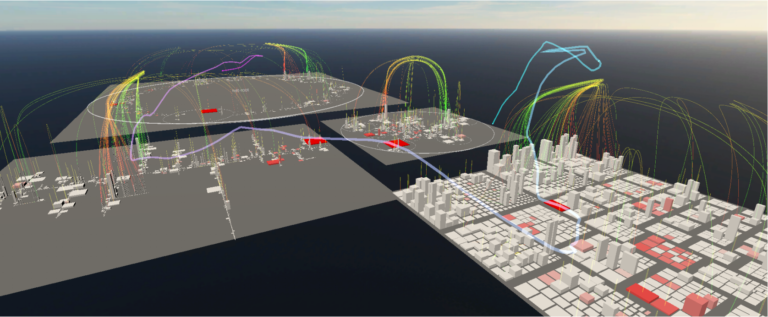
Studying software visualization often includes the evaluation of paths collected from participants of a study (e.g., eye tracking or movements in virtual worlds). In this paper, we explore clustering techniques to automate the process of grouping similar paths. The heart of the evaluated approach is a distance metric between paths that is based on dynamic time warping (DTW). DTW aligns two paths based on any given distance metric between their data points so as to minimize the distance between those paths—alignment may stretch or compress time for best fit.
With a data set of 127 paths of professional software developers
exploring code cities in virtual reality, we evaluate the clustering
based on objective quality indices and manual inspection.
Index Terms—dynamic time warping, clustering, path data,
time series
Analyzing and maintaining large software systems is a challenging task due to the sheer amount of information contained therein. To overcome this problem, Steinbrückner developed a visualization technique named EvoStreets. Utilizing the city metaphor, EvoStreets are well suited to visualize the hierarchical structure of a software as well as hotspots regarding certain aspects. Early implementations of this approach use threedimensional rendering on regular two-dimensional displays. Recently, though, researchers have begun to visualize EvoStreets in virtual reality using head-mounted displays, claiming that this environment enhances user experience. Yet, there is little research on comparing the differences of EvoStreets visualized in virtual reality with EvoStreets visualized in conventional environments. This paper presents a controlled experiment, involving 34 participants, in which we compared the EvoStreet visualization technique in different environments, namely, orthographic projection with keyboard and mouse, 2.5D projection with keyboard and mouse, and virtual reality with head-mounted displays and hand-held controllers. Using these environments, the participants had to analyze existing Java systems regarding software clones. According to our results, it cannot be assumed that: 1) the orthographic environment takes less time to find an answer, 2) the 2.5D and virtual reality environments provide better results regarding the correctness of edge-related tasks compared to the orthographic environment, and 3) the performance regarding time and correctness differs between the 2.5D and virtual reality environments.
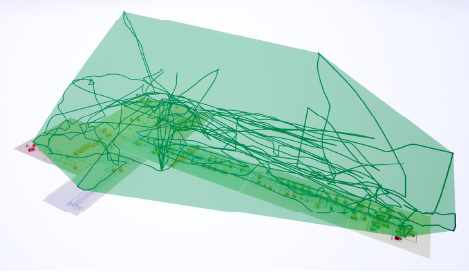
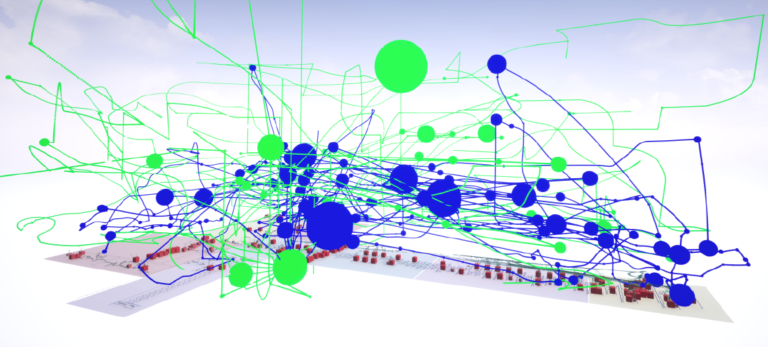
Software visualization is a growing field of research, in which developers are assisted in understanding and analyzing complex applications by mapping different aspects of a software system onto visual attributes. Under the assumption that virtual reality, due to the higher degree of immersion, may enhance user experience, researchers have begun to port existing visualization techniques to this environment. Oftentimes, layout algorithms and user interaction methods are more or less transferred one-to-one, though little is known about the effect of virtual reality in visual analytics and program comprehension. Moreover, little research on the behavior of developers in different threedimensional visualization environments has been done yet. This paper extends the results of a previous controlled experiment, in which the EvoStreets visualization technique was compared in different two- and three-dimensional environments. In the original experiment, we could not find evidence that any of the environments, namely, 2D, 2.5D, and virtual reality, effects the time required to find an answer or the correctness of the given answer. However, we found indications that movement patterns differ between the 2.5D and the virtual reality environments. For this paper, we analyzed and refined the movement trajectories that have been recorded in the previous experiment. We found significant differences for some of the tasks that had to be solved by the participants. In particular, we found evidence that the path length, average speed, and occupied volume differ. Though we could find significant correlations between these metrics and correctness, we found indications that there is a correlation with time, which, in turn, differs significantly between the 2.5D and the VR environments for many tasks. These findings may have implications on the design of visualizations, interactions, and recommendation systems for these different environments.
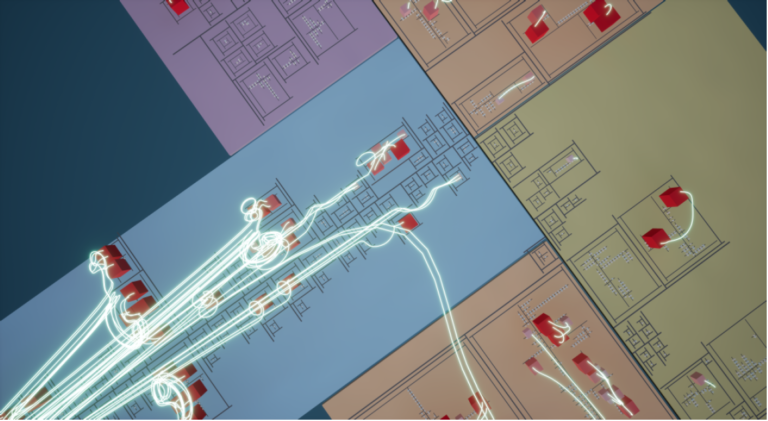
Analyzing and maintaining large software systems is a challenging task due to the sheer amount of information contained therein. To overcome this problem, Steinbrückner developed a visualization technique named EvoStreets. Utilizing the city metaphor, EvoStreets are well suited to visualize the hierarchical structure of a software as well as hotspots regarding certain aspects. Early implementations of this approach use threedimensional rendering on regular two-dimensional displays. Recently, though, researchers have begun to visualize EvoStreets in virtual reality using head-mounted displays, claiming that this environment enhances user experience. Yet, there is little research on comparing the differences of EvoStreets visualized in virtual reality with EvoStreets visualized in conventional environments. This paper presents a controlled experiment, involving 34 participants, in which we compared the EvoStreet visualization technique in different environments, namely, orthographic projection with keyboard and mouse, 2.5D projection with keyboard and mouse, and virtual reality with head-mounted displays and hand-held controllers. Using these environments, the participants had to analyze existing Java systems regarding software clones. According to our results, it cannot be assumed that: 1) the orthographic environment takes less time to find an answer, 2) the 2.5D and virtual reality environments provide better results regarding the correctness of edge-related tasks compared to the orthographic environment, and 3) the performance regarding time and correctnes differs between the 2.5D and virtual reality environments.
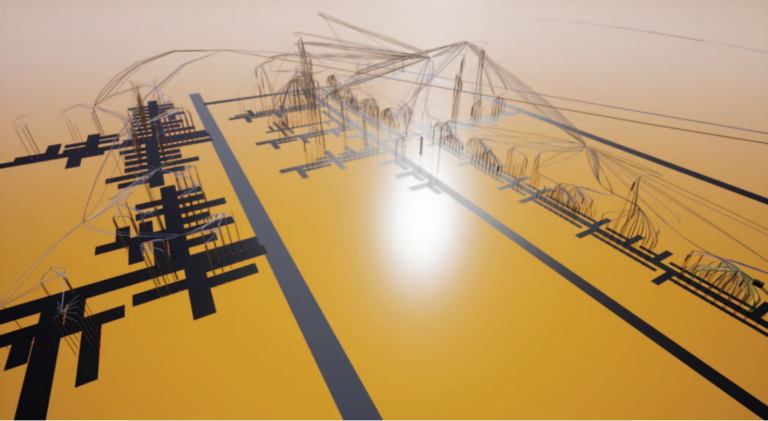
Multiple authors have proposed a city metaphor for visualizing software. While early approaches have used threedimensional rendering on standard twodimensional displays, recently researchers have started to use head-mounted displays to visualize software cities in immersive virtual reality systems (IVRS). For IVRS of a higher order it is claimed that they offer a higher degree of engagement and immersion as well as more Intuitive interaction. On the other hand, spatial orientation may be a challenge in IVRS as already reported by studies on the use of IVRS in domains outside of software engineering such as gaming, education, training, and mechanical engineering or maintenance tasks. This might be even more true for the city metaphor for visualizing software. Software is immaterial and, hence, has no natural appearance. Only a limited number of abstract aspects of software are mapped onto visual representations so that software cities generally lack the details of the real world, such as the rich
variety of objects or fine textures, which are often used as clues for orientation in the real world. In this paper, we report on an experiment in which we compare navigation in a particular kind of software city (EvoStreets) in two variants of IVRS. One with head-mounted display and hand controllers versus a 3D desktop visualization on a standard display with keyboard and mouse interaction involving 20 participants.
Supported Hardware
Imagine you could use SEE on any preferable hardware. But hold on a second! You can do this! In addition to standard desktop PCs, SEE is integrating hardware for augmented and virtual reality, too.
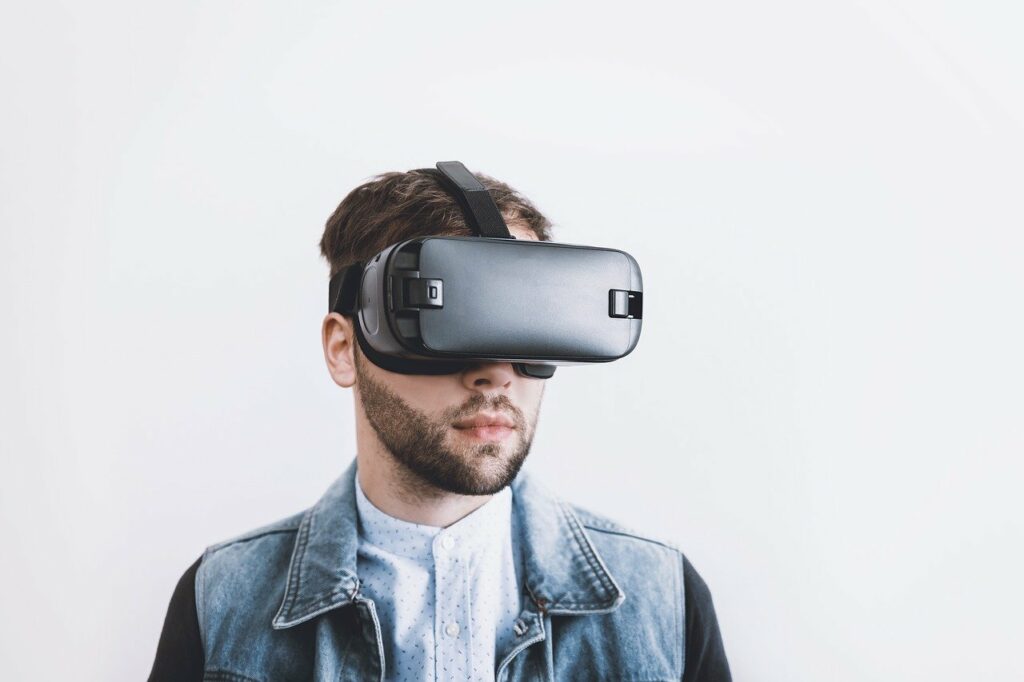
Augmented reality may be the future. The idea behind SEE is creating visualizations of software in the real world.
Yes, augmented reality hardware is supported and indeed multi-user capable!
Everyone who has seen Matrix has wondered whether at some point in time it would be possible to see the written code and what it does. And with SEE this dream comes true! VR hardware is fully supported and gives every developer the chance to actually see their software!
Touchbased hardware is a great way to achieve a co-operative intuitive workflow. Therefore touchbased devices are supported, too.
Desktop computers with mouse, keyboard, and 2D monitors are the standard equipment for most developers. It goes without saying that SEE runs on this kind of hardware for Linux, Mac, and Windows.
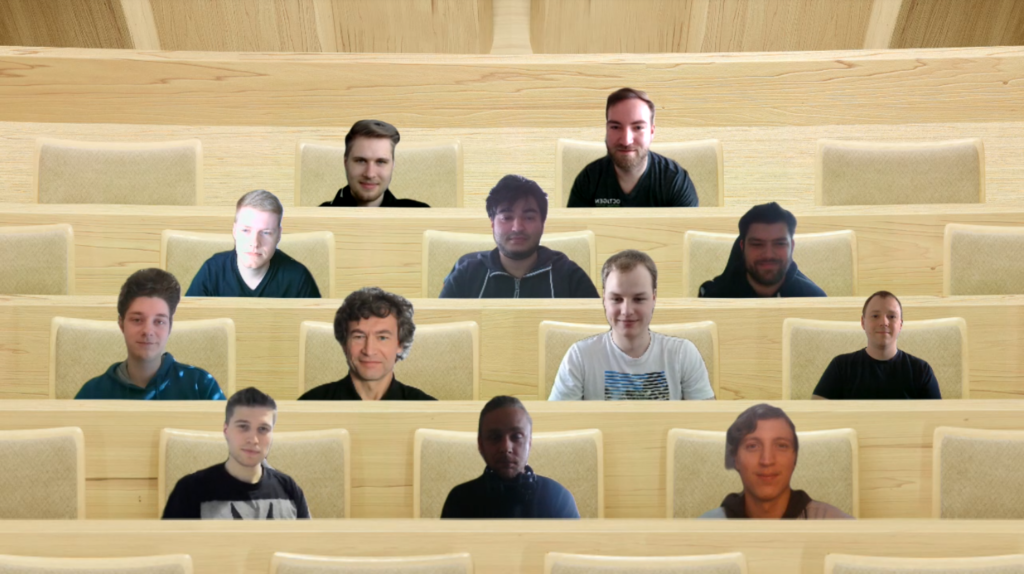
Our Team
- Prof. Dr. Rainer Koschke
- Marcel Steinbeck
- Martin Schröer
- Lino Goedecke
- Leonard Haddad
- Nick Seedorf
- Simon Leykum
- Sören Untiedt
- Thore Frenzel
- Robin Theiß
- Thorsten Friedewold
- Jan Woiton
- Christian Müller
- Moritz Blecker
- Falko Galperin
- Hannes Masuch
- Lennart Kipka
- Robert Bohnsack
- Nina Unterberg
- David Wagner
- Kevin Döhl
- Torben Groß
