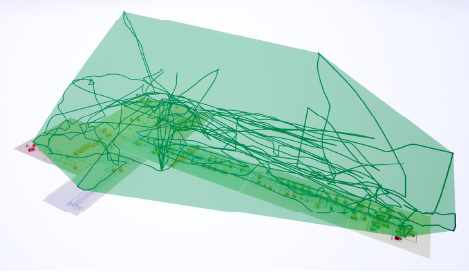
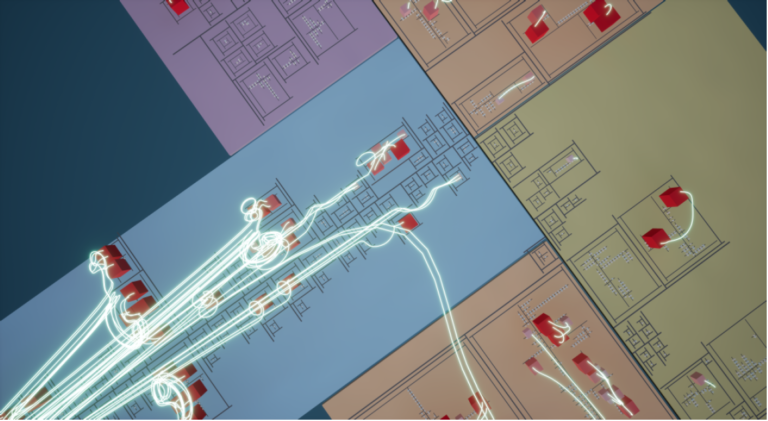
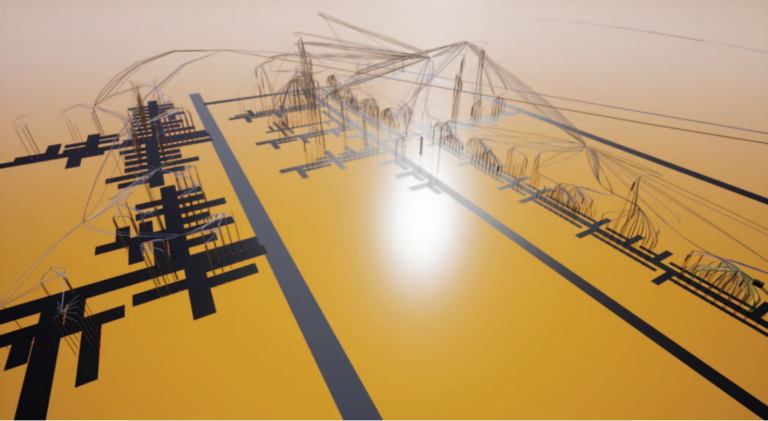
Studying software visualization often includes the evaluation of paths collected from participants of a study (e.g., eye tracking or movements in virtual worlds). In this paper, we explore clustering techniques to automate the process of grouping similar paths. The heart of the evaluated approach is a distance metric between paths that is based on dynamic time warping (DTW). DTW aligns two paths based on any given distance metric between their data points so as to minimize the distance between those paths—alignment may stretch or compress time for best fit. With a data set of 127 paths of professional software developers exploring code cities in virtual reality, we evaluate the clustering based on objective quality indices and manual inspection. Index Terms—dynamic time warping, clustering, path data, time series
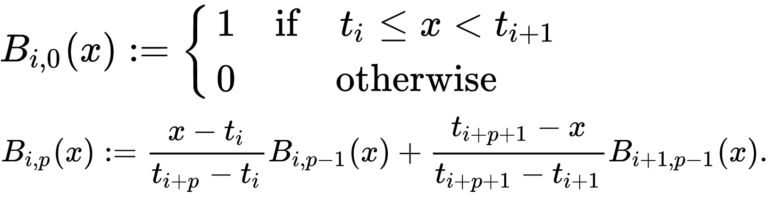
Analyzing and maintaining large software systems is a challenging task due to the sheer amount of information contained therein. To overcome this problem, Steinbruckner ¨ developed a visualization technique named EvoStreets. Utilizing the city metaphor, EvoStreets are well suited to visualize the hierarchical structure of a software as well as hotspots regarding certain aspects. Early implementations of this approach use threedimensional rendering on regular two-dimensional displays. Recently, though, researchers have begun to visualize EvoStreets in virtual reality using head-mounted displays, claiming that this environment enhances user experience. Yet, there is little research on comparing the differences of EvoStreets visualized in virtual reality with EvoStreets visualized in conventional environments. This paper presents a controlled experiment, involving 34 participants, in which we compared the EvoStreet visualization technique in different environments, namely, orthographic projection with keyboard and mouse, 2.5D projection with keyboard and mouse, and virtual reality with head-mounted displays and hand-held controllers. Using these environments, the participants had to analyze existing Java systems regarding software clones. According to our results, it cannot be assumed that: 1) the orthographic environment takes less time to find an answer, 2) the 2.5D and virtual reality environments provide better results regarding the correctness of edge-related tasks compared to the orthographic environment, and 3) the performance regarding time and correctness differs between the 2.5D and virtual reality environments
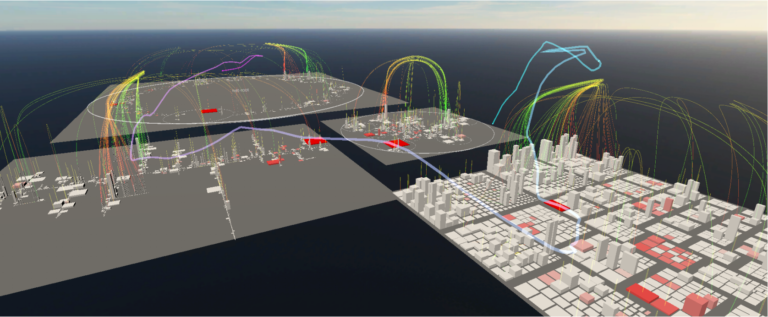
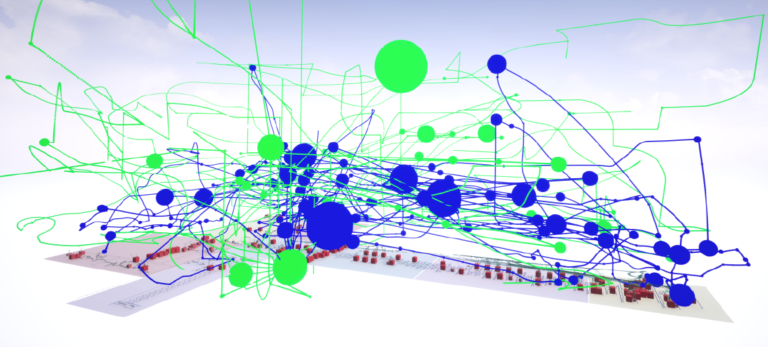
Software visualization is a growing field of research, in which developers are assisted in understanding and analyzing complex applications by mapping different aspects of a software system onto visual attributes. Under the assumption that virtual reality, due to the higher degree of immersion, may enhance user experience, researchers have begun to port existing visualization techniques to this environment. Oftentimes, layout algorithms and user interaction methods are more or less transferred one-to-one, though little is known about the effect of virtual reality in visual analytics and program comprehension. Moreover, little research on the behavior of developers in different threedimensional visualization environments has been done yet. This paper extends the results of a previous controlled experiment, in which the EvoStreets visualization technique was compared in different two- and three-dimensional environments. In the original experiment, we could not find evidence that any of the environments, namely, 2D, 2.5D, and virtual reality, effects the time required to find an answer or the correctness of the given answer. However, we found indications that movement patterns differ between the 2.5D and the virtual reality environments. For this paper, we analyzed and refined the movement trajectories that have been recorded in the previous experiment. We found significant differences for some of the tasks that had to be solved by the participants. In particular, we found evidence that the path length, average speed, and occupied volume differ. Though we could find significant correlations between these metrics and correctness, we found indications that there is a correlation with time, which, in turn, differs significantly between the 2.5D and the VR environments for many tasks. These findings may have implications on the design of visualizations, interactions, and recommendation systems for these different environments.
Analyzing and maintaining large software systems is a challenging task due to the sheer amount of information contained therein. To overcome this problem, Steinbruckner ¨ developed a visualization technique named EvoStreets. Utilizing the city metaphor, EvoStreets are well suited to visualize the hierarchical structure of a software as well as hotspots regarding certain aspects. Early implementations of this approach use threedimensional rendering on regular two-dimensional displays. Recently, though, researchers have begun to visualize EvoStreets in virtual reality using head-mounted displays, claiming that this environment enhances user experience. Yet, there is little research on comparing the differences of EvoStreets visualized in virtual reality with EvoStreets visualized in conventional environments. This paper presents a controlled experiment, involving 34 participants, in which we compared the EvoStreet visualization technique in different environments, namely, orthographic projection with keyboard and mouse, 2.5D projection with keyboard and mouse, and virtual reality with head-mounted displays and hand-held controllers. Using these environments, the participants had to analyze existing Java systems regarding software clones. According to our results, it cannot be assumed that: 1) the orthographic environment takes less time to find an answer, 2) the 2.5D and virtual reality environments provide better results regarding the correctness of edge-related tasks compared to the orthographic environment, and 3) the performance regarding time and correctnes
Multiple authors have proposed a city metaphor for visualizing software. While early approaches have used threedimensional rendering on standard two-dimensional displays, recently researchers have started to use head-mounted displays to visualize software cities in immersive virtual reality systems (IVRS). For IVRS of a higher order it is claimed that they offer a higher degree of engagement and immersion as well as more intuitive interaction. On the other hand, spatial orientation may be a challenge in IVRS as already reported by studies on the use of IVRS in domains outside of software engineering such as gaming, education, training, and mechanical engineering or maintenance tasks. This might be even more true for the city metaphor for visualizing software. Software is immaterial and, hence, has no natural appearance. Only a limited number of abstract aspects of software are mapped onto visual representations so that software cities generally lack the details of the real world, such as the rich variety of objects or fine textures, which are often used as clues for orientation in the real world. In this paper, we report on an experiment in which we compare navigation in a particular kind of software city (EvoStreets) in two variants of IVRS. One with head-mounted display and hand controllers versus a 3D desktop visualization on a standard display with keyboard and mouse interaction involving 20 participants.